
Freelance data visualisation and web mapping
I build interfaces that make data readable, from thematic maps to real-time monitoring screens, fully remote. For Sciences Po, I developed Khartis V3, the mapping application its Cartography Lab designed.








Data visualisation and mapping projects
Thematic maps for Sciences Po, real-time wildlife monitoring for Biodiv-Wind and training dashboards for WorkoutGen.
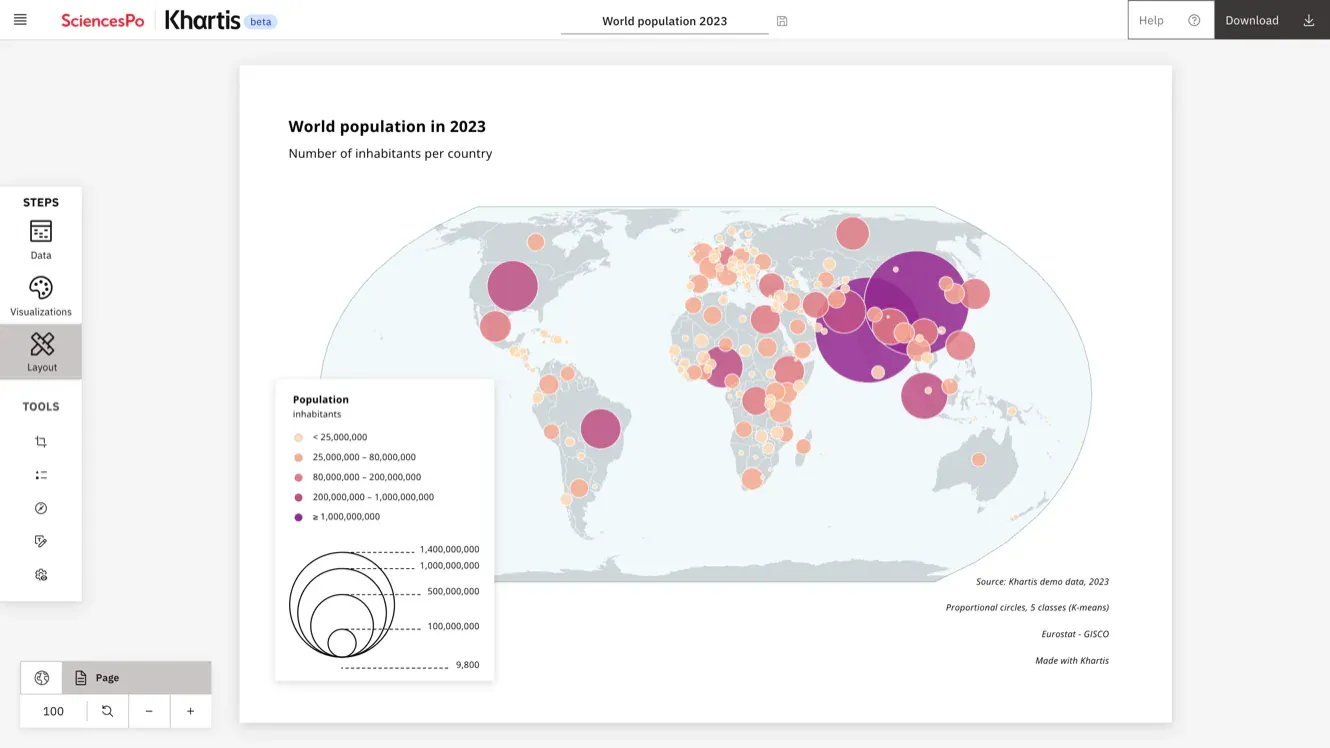
Sciences Po's thematic mapping tool
Print-quality maps from up to millions of rows, computed in the browser, even offline, with no data sent to a server. A complete rewrite designed by the Cartography Lab, which I developed
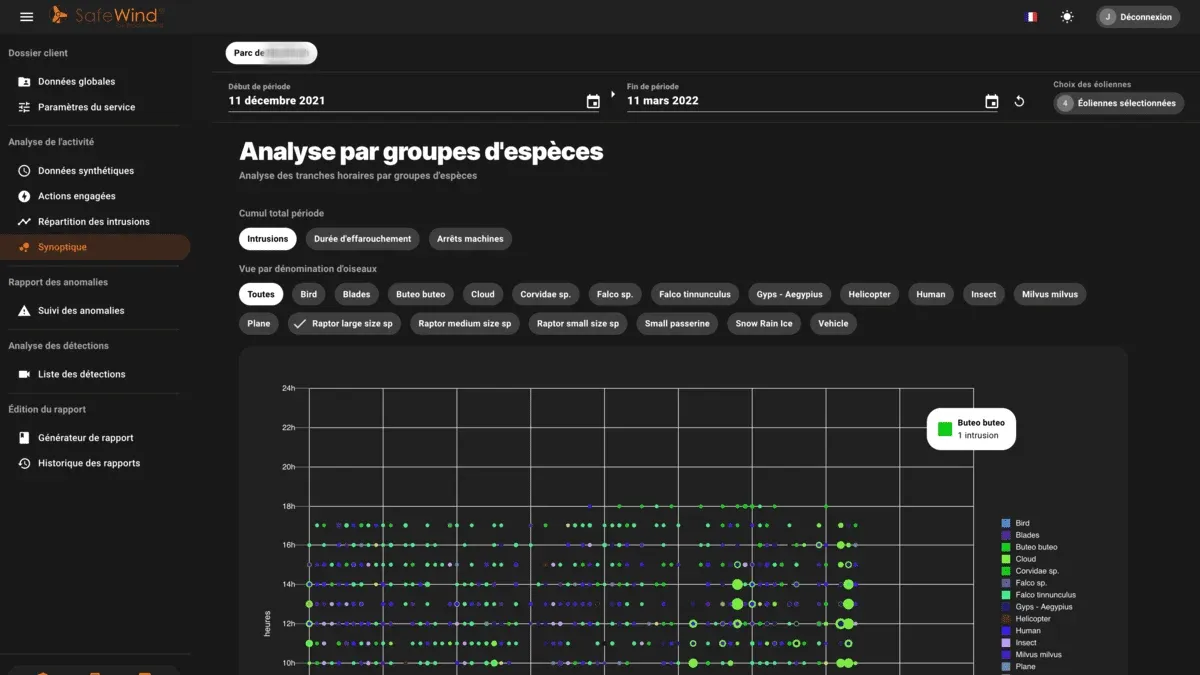
Real-time wildlife monitoring on wind farms
Operators follow wildlife protection on their wind farms in real time, through the Nivo charts and Leaflet maps of SafeWind's new interface
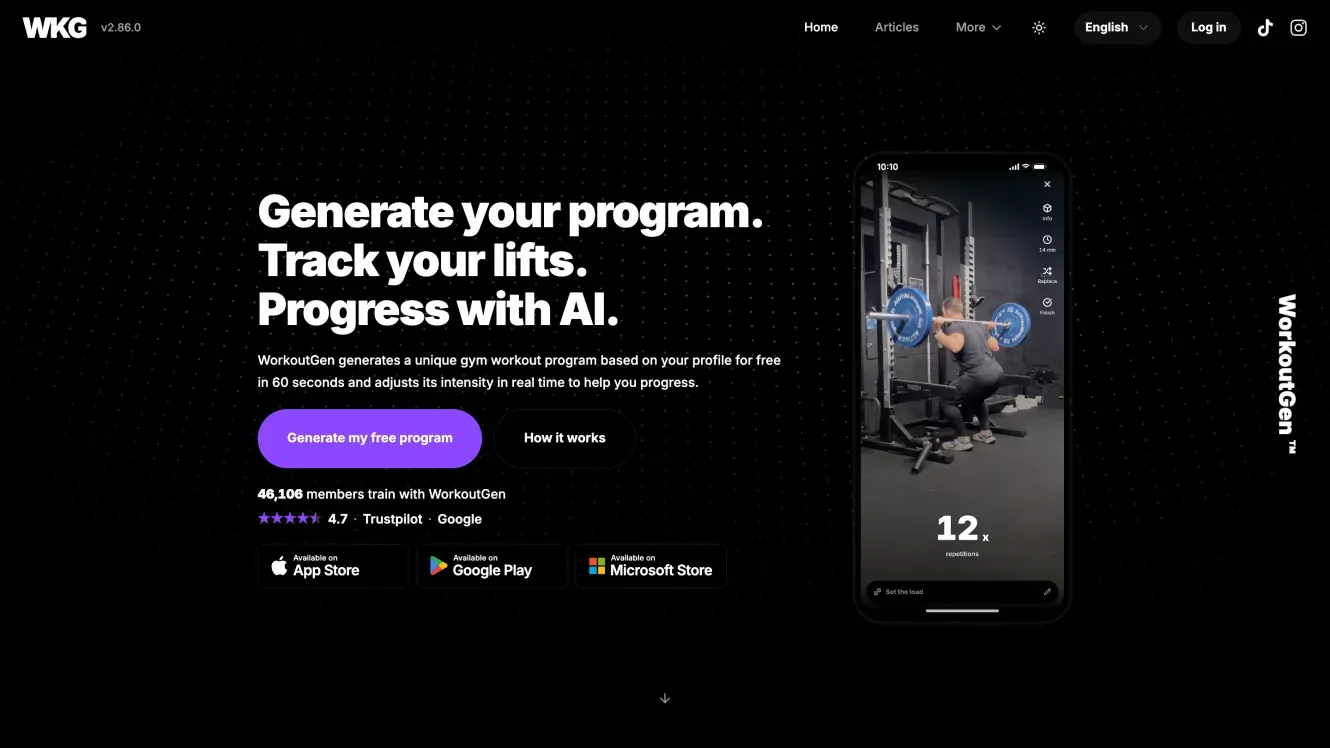
Training dashboards in a workout app
Progress charts, an athlete radar and monthly recaps turn every logged session into figures members can read
- React 19
- TypeScript
- Recharts
- PWA
Large datasets that stay readable and responsive
The difficulty is rarely drawing a chart. It is keeping the interface responsive as the dataset grows, choosing a representation that does not mislead, and deciding what the browser computes rather than the server.
On Khartis, all of it happens in the browser: DuckDB-WASM and Apache Arrow analyse the data in a Web Worker, then Deck.gl and MapLibre draw the maps with WebGL.
I adapt to the libraries your product already uses, such as D3, ECharts or Mapbox.
Fundamentals
- SVG
- Canvas
- WebGL
- Map projections
- Map tiles
- Readable colour scales
- Memory per row
Possible deliverables
- Interactive map with thematic layers and legends
- In-browser data processing for datasets too large for a round trip
- WebGL rendering for dense point, line or polygon layers
- Real-time dashboard with live charts and monitoring views
- Data model and format choices, including columnar formats such as Apache Arrow
- Engagement
- Team support, project or application takeover
- Schedule
- Agreed for the engagement
- Indicative rate
- €550 excl. VAT / day (October 2026)
- Collaboration
- Fully remote
- Start date
- To be agreed
From raw datasets to maps people can read
Six years of data interfaces for wind farm operators, researchers and athletes. I care as much about what the reader understands as about how fast the screen responds.
Through jCode, I work with public institutions, established companies and startups. My own products, WorkoutGen and Ragmir, taught me what follows a release.

- of web development
- 10 years
- missions completed on Malt (November 2026)
- 80+
- as a freelancer
- 7 years
- from 47 client ratings on Malt (November 2026)
- 5.0/5
Other areas of expertise
What clients and colleagues say
“Jean-Baptiste Thery est une perle rare : à l'écoute, super pro, très réactif, disponible, créatif, perfectionniste, un des meilleurs développeurs que j'ai pu rencontrer dans toute ma carrière. Partir avec Jean Baptiste dans un projet, c'est l'assurance d'un travail parfait.” Malt
“I strongly recommend working with JB. He was instrumental in getting our frontend off the ground, handling everything with zeal, unwavering dedication, and unparalleled reliability.” LinkedIn
“Jean-Baptiste est quelqu'un de passionné qui ne compte pas ses heures et qui se focus sur le résultat final. Il a la tête bien faite, comprends très vite les enjeux, les besoins et assure un delivery rapide et qualitatif. Je ne peux que le recommander.”MaltLet's talk about your project.
Tell me what you want to build or improve, your budget and your target date.
- Fully remote
- English or French
- France · UK · US
Frequently asked questions
How large a dataset can the browser handle?
Up to millions of rows in Khartis's case, analysed client side with DuckDB-WASM and no server. The practical limit depends on the file format, the columns you need and your readers' devices.
Do you choose the cartographic representation?
Not on my own. On Khartis, the semiology and the cartographic algorithms came from Sciences Po's Cartography Lab, and I handled the development; without that expertise in house, we decide the representation together.
Which mapping libraries do you use?
Deck.gl and MapLibre for WebGL layers, Leaflet for simpler cases, and the Google Maps API for Suzuki France's dealer search.
Can you build a complete data application, not just the charts?
Yes. Khartis V3 covers the whole path from a loaded dataset to a finished map, and SafeWind's interface brought charts, maps and sign-in together. The web application development service sets out how such a product goes from a first version to production.